VM Operating System Metrics
For each application deployed on virtual machines (VMs), a single dashboard is implemented and provided to the application owners. This dashboard delivers detailed OS-level metrics, including CPU, memory, disk usage, and network activity, offering valuable insights into the performance and resource utilization of the virtual machines. By consolidating these metrics into a single view, application owners can efficiently monitor and manage their applications, ensuring optimal performance and stability of their VM-based environments
Prompts
| No | Prompt | Description |
|---|---|---|
| 1 | Time Range | Define the time range for which the dashboard will display data |
Note: Data are available for the most recent ten (10) days. The selected time range must fall within this interval for results to be displayed.
Sections
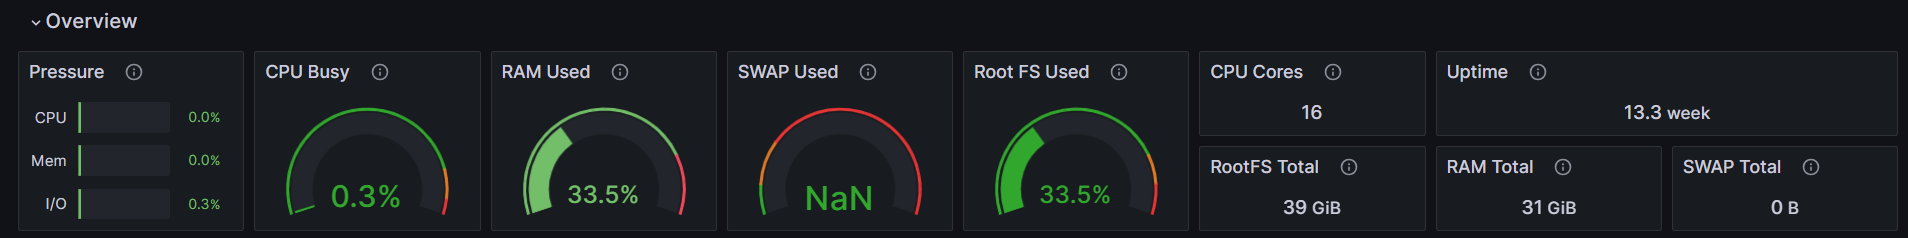
Overview
| No | Frame | Description |
|---|---|---|
| 1 | Pressure | Dispalys a detailed view of resource contention within the system |
| 2 | CPU Busy | Displays the busy state of all CPU cores together |
| 3 | RAM Used | Displays the portion of physical memory that is unavailable for use, including memory allocated to active processes, buffers, and caches |
| 4 | SWAP Used | Displays the amount of swap space currently in use, indicating how much disk-based memory is being utilized to supplement RAM |
| 5 | RootFS Used | Displays the amount of disk space currently utilized on the root filesystem |
| 6 | CPU Cores | Displays the total number of CPU cores |
| 7 | Uptime | Dispalys the system uptime |
| 8 | RootFS Total | Displays the total capacity of the root filesystem, showing the overall disk space available for the system’s primary file storage |
| 9 | RAM Total | Displays the total physical memory (RAM) installed on the system |
| 10 | SWAP Total | Displays the total swap space available on the system |
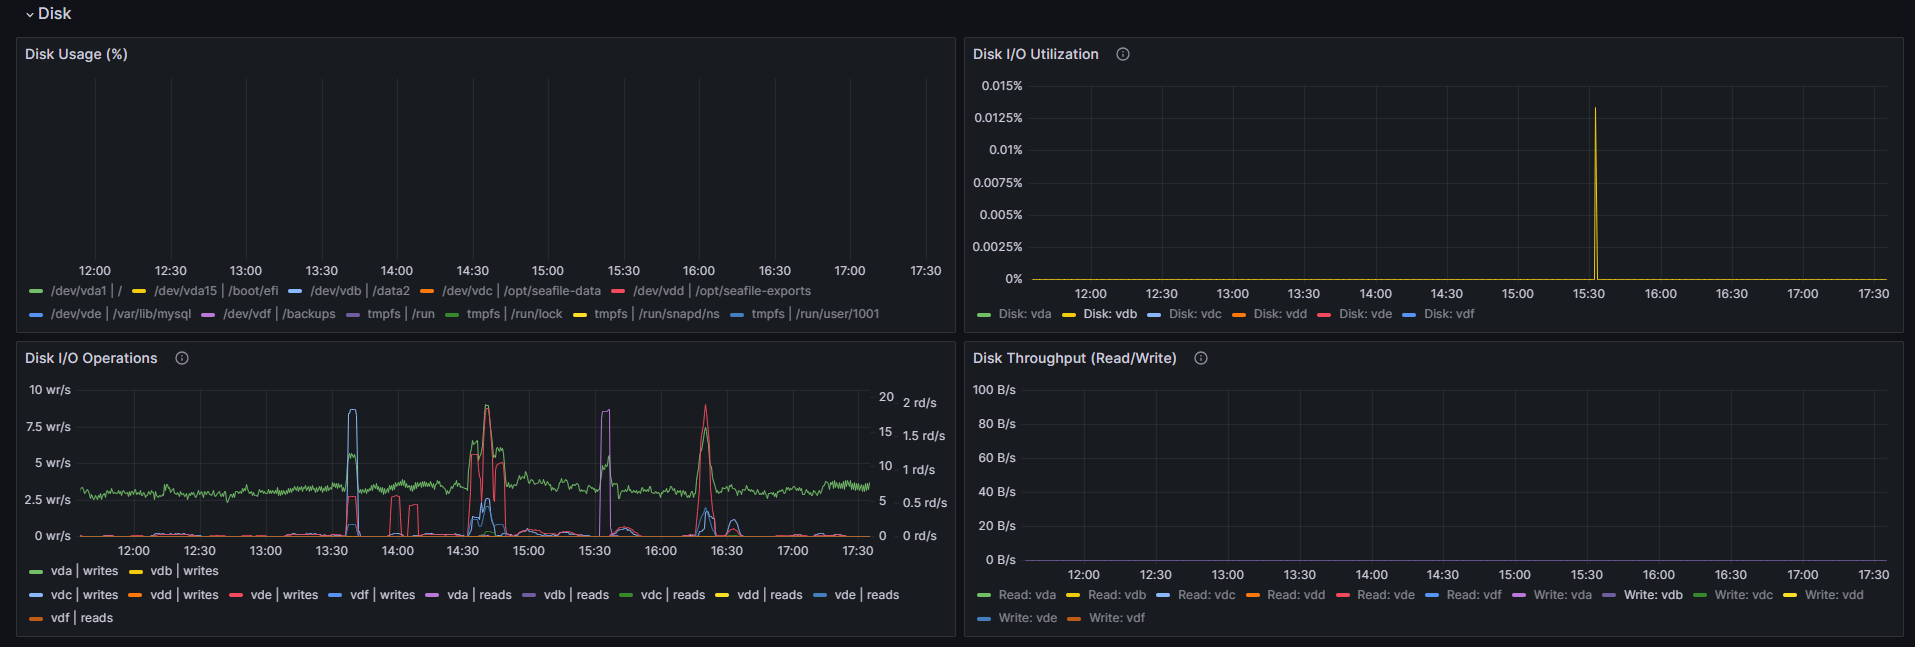
Disk
| No | Frame | Description |
|---|---|---|
| 1 | Disk Usage | Displays the percentage of disk space currently in use on the system, highlighting storage consumption across partitions or volumes |
| 2 | Disk I/O Utilization | Displays the percentage of time the disk is actively engaged in I/O operations, indicating how much of the disk’s total available time is spent reading or writing data |
| 3 | Disk I/O Operations | Displays the number of read and write operations performed per second on the disk, providing insight into the system’s disk activity and workload |
| 4 | Disk Throughput (Read/Write) | Displays the rate of data transfer to and from the disk, measured in bytes per second. It provides insight into the disk read and write throughput, helping to evaluate disk performance and detect potential bottlenecks in data transfer |
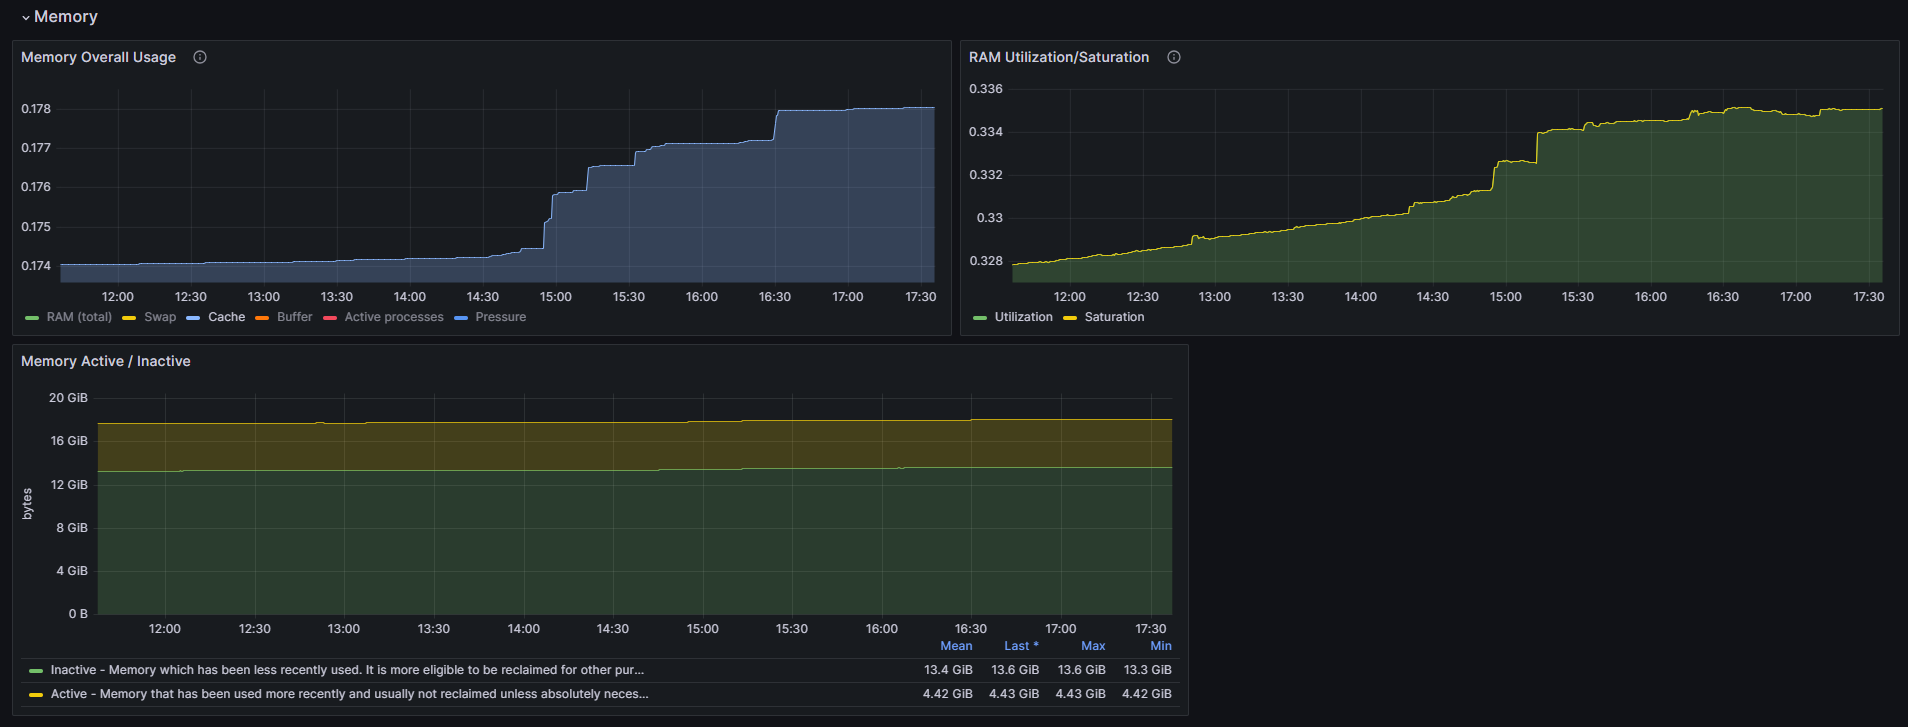
Memory
| No | Frame | Description |
|---|---|---|
| 1 | Memory Overall Usage | - RAM : Percentage of total RAM in use by the system (includes buffers and cache) - Swap: Percentage of swap space in use (memory pressure indicator if high) - Cache: Percentage of RAM used to cache frequently accessed data for faster read/write - Buffer: Percentage of memory allocated for buffers (memory pressure indicator) - Active: Percentage of memory in use for active processes - Pressure: When available memory is low/high performing |
| 2 | RAM Utilization / Saturation | - Utilization: How much memory is actively in use - Saturation: How much the system is relying on swap, indicating high memory pressure |
| 3 | Memory Active / Inactive | - Inactive: Memory which has been less recently used. It is more eligible to be reclaimed for other purposes - Active: Memory that has been used more recently and usually not reclaimed unless absolutely necessary |
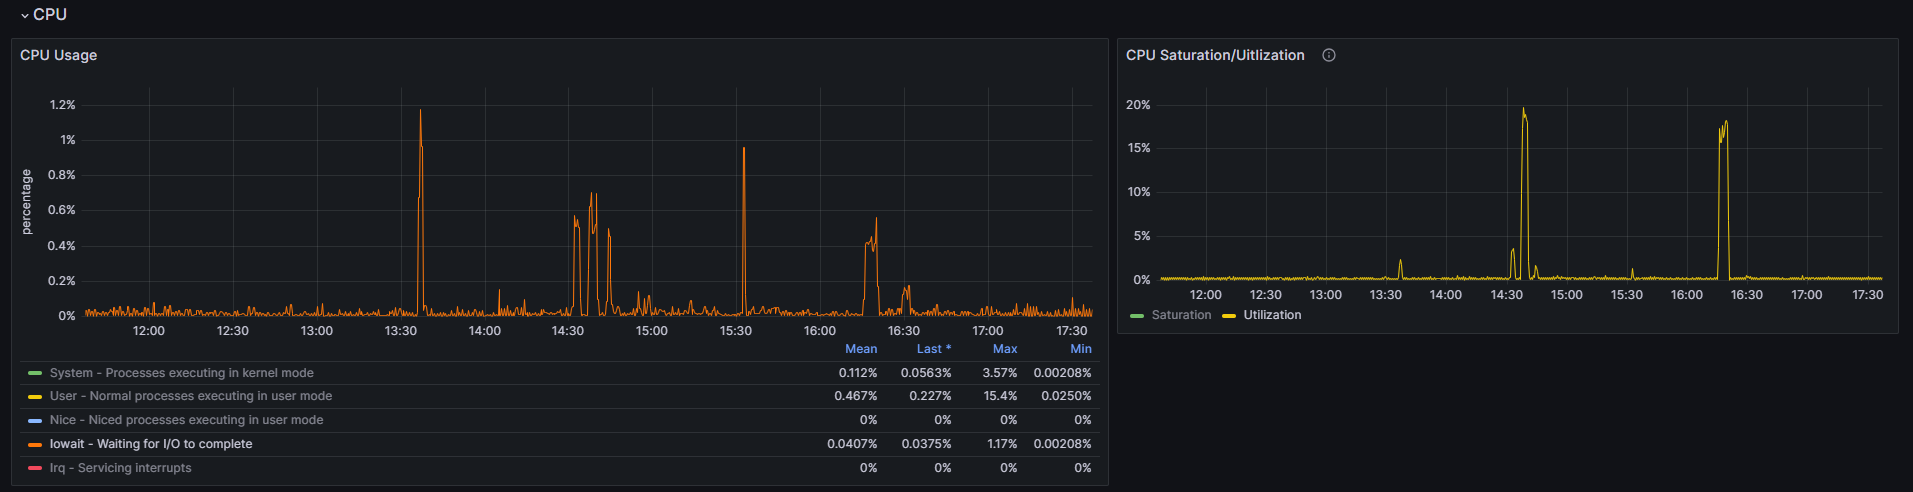
CPU
| No | Frame | Description |
|---|---|---|
| 1 | CPU Usage | - System : Processes executing in kernel mode - User : Normal processes executing in user mode - Nice : Niced processes executing in user mode - Iowait : Waiting for I/O to complete - Irq : Servicing interrupts - Softirq : Servicing softirqs - Steal : Time spent in other operating systems when running in a virtualized environment - Idle : Waiting for something to happen |
| 2 | CPU Saturation/Utilization | - Saturation: Displays the proportion of time the CPU is in contention or actively processing tasks - Utilization: Displays an overview of how much of the CPU’s capacity is being utilized across all cores, helping to identify whether the system is underutilized or nearing its performance limits |
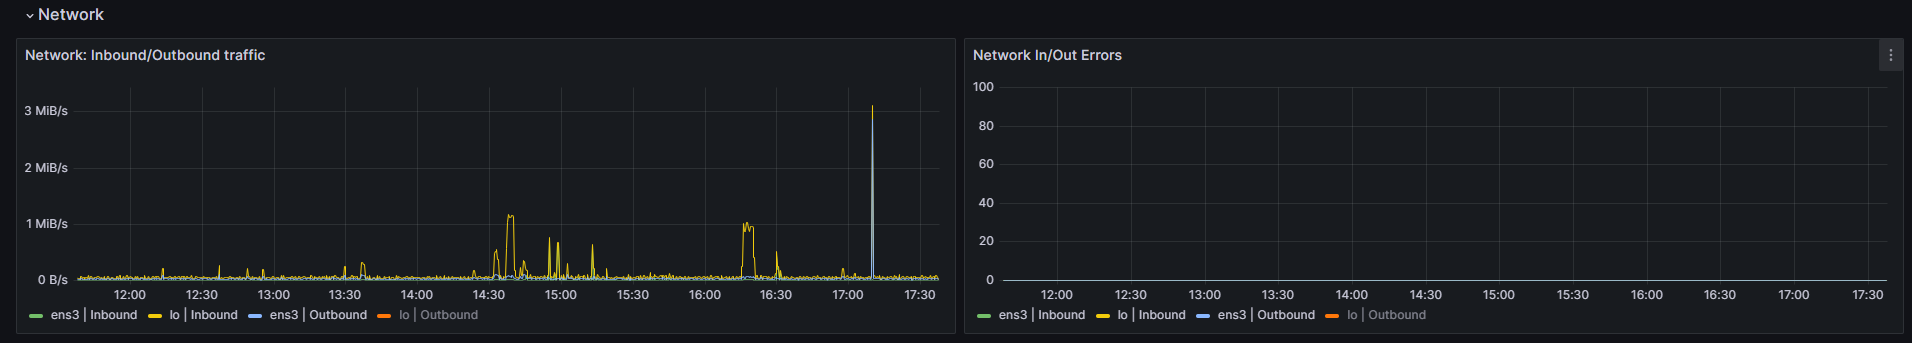
Network
| No | Frame | Description |
|---|---|---|
| 1 | Inbound/Outbound Traffic | Displays the volume of incoming and outgoing network traffic for each device, providing a clear view of data transfer rates and network utilization |
| 2 | Inbound/Outbound Errors | Displays the count of incoming and outgoing errors for each network device, helping to detect issues like packet loss or transmission failures |