K8s Operating System Metrics
For each application deployed in Rancher, two dashboards are implemented and provided to the application owners to facilitate monitoring and management. The first dashboard delivers detailed OS-level metrics for the workloads, offering insights into resource utilization such as CPU, memory, and disk usage at the operating system level. The second dashboard focuses on pods, presenting metrics such as resource limits, requests, and performance data. These dashboards empower application owners with the visibility needed to optimize performance and ensure operational stability.
Dashboard for Workloads
Prompts
| No | Prompt | Description |
|---|---|---|
| 1 | Time Range | Define the time range for which the dashboard will display data |
Note: Data are available for the most recent ten (10) days. The selected time range must fall within this interval for results to be displayed.
Sections
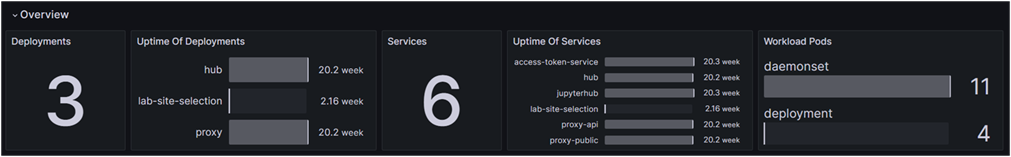
Overview
| No | Frame | Description |
|---|---|---|
| 1 | Deployments | Displays the total number of deployments |
| 2 | Uptime of Deployments | Displays the uptime of individual deployments |
| 3 | Services | Displays the total number of active services |
| 4 | Uptime of Services | Displays the uptime of individual services |
| 5 | Workload Pods | Displays the number of workload pods categorized by type |
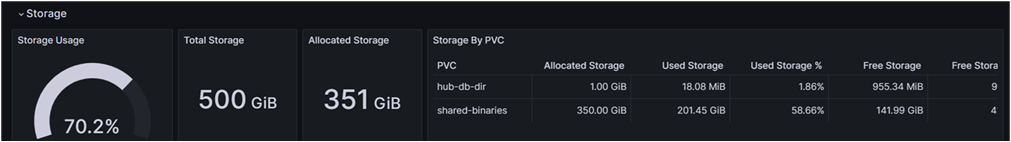
Storage
| No | Frame | Description |
|---|---|---|
| 1 | Storage Usage | Displays the percentage of total storage used out of the allocated storage |
| 2 | Total Storage | Displays the total available storage capacity |
| 3 | Allocated Storage | Displays the total allocated storage capacity |
| 4 | PVC | Displays the name of the PVC |
| 5 | Allocated Storage (By PVC) | Displays the allocated storage for each PVC |
| 6 | Used Storage (By PVC) | Displays the used storage for each PVC |
| 7 | Used Storage % (By PVC) | Displays the percentage of storage used out of the allocated storage for each PVC |
| 8 | Free Storage (By PVC) | Displays the remaining free storage for each PVC |
| 9 | Free Storage % (By PVC) | Displays the percentage of free storage available for each PVC |
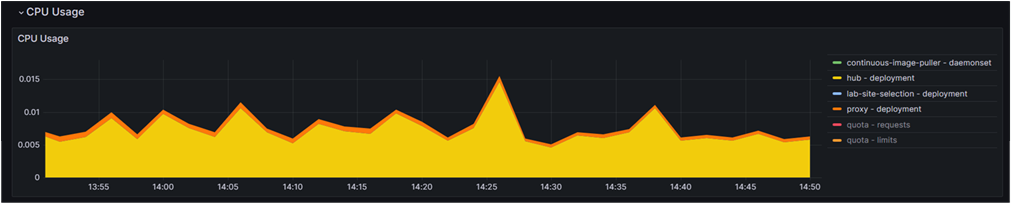
CPU Usage
| No | Frame | Description |
|---|---|---|
| 1 | CPU Usage | Displays the CPU usage over time for different deployments |
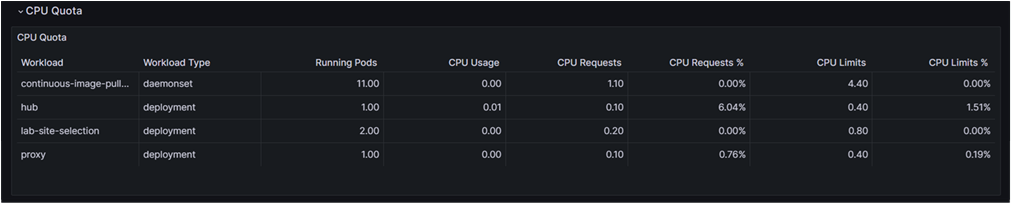
CPU Quota
| No | Field | Description |
|---|---|---|
| 1 | Workload | Displays the name of the workload being monitored |
| 2 | Workload Type | Displays the type of workload |
| 3 | Running Pods | Displays the number of currently running pods for each workload |
| 4 | CPU Usage | Displays the actual CPU usage for each workload |
| 5 | CPU Requests | Displays the amount of CPU resources requested by each workload |
| 6 | CPU Requests % | Displays the percentage of CPU requests compared to the total available CPU resources |
| 7 | CPU Limits | Displays the upper limit of CPU resources allowed for each workload |
| 8 | CPU Limits % | Displays the percentage of CPU limits compared to the total available CPU resources |
Memory Usage
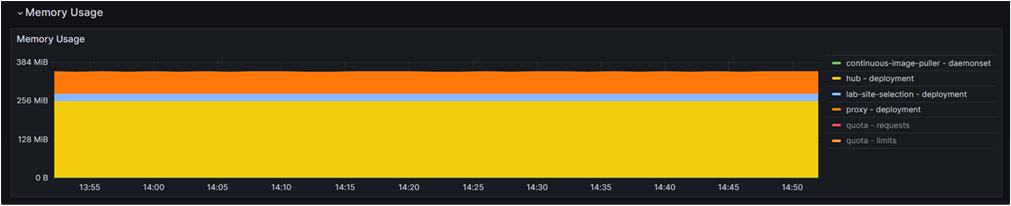
| No | Frame | Description |
|---|---|---|
| 1 | Memory Usage | Displays the memory usage over time for different deployments |
Memory Quota
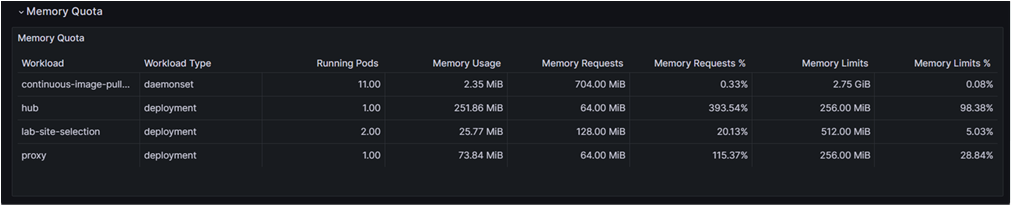
| No | Field | Description |
|---|---|---|
| 1 | Workload | Displays the name of the workload being monitored |
| 2 | Workload Type | Displays the type of workload |
| 3 | Running Pods | Displays the number of currently running pods for each workload |
| 4 | Memory Usage | Displays the actual memory usage for each workload |
| 5 | Memory Requests | Displays the amount of memory requested by each workload |
| 6 | Memory Requests % | Displays the percentage of memory requests compared to the total available memory resources |
| 7 | Memory Limits | Displays the upper limit of memory resources allowed for each workload |
| 8 | Memory Limits % | Displays the percentage of memory limits compared to the total available memory resources |
Current Network Usage
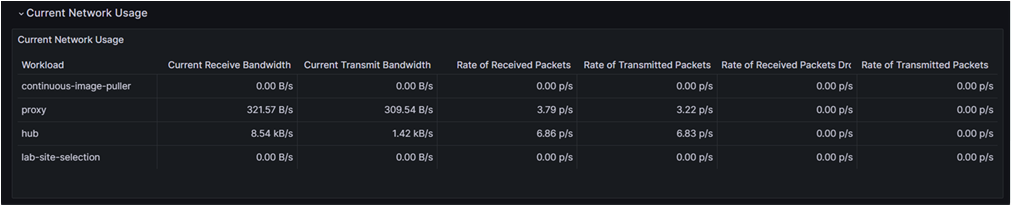
| No | Field | Description |
|---|---|---|
| 1 | Workload | Displays the name of the workload being monitored |
| 2 | Current Receive Bandwidth | Displays the current rate of data received by the workload in bytes per second |
| 3 | Current Transmit Bandwidth | Displays the current rate of data transmitted by the workload in bytes per second |
| 4 | Rate of Received Packets | Displays the rate at which packets are received by the workload in packets per second |
| 5 | Rate of Transmitted Packets | Displays the rate at which packets are transmitted by the workload in packets per second |
| 6 | Rate of Received Packets Dropped | Displays the rate at which received packets are dropped in packets per second |
| 7 | Rate of Transmitted Packets Dropped | Displays the rate at which transmitted packets are dropped in packets per second |
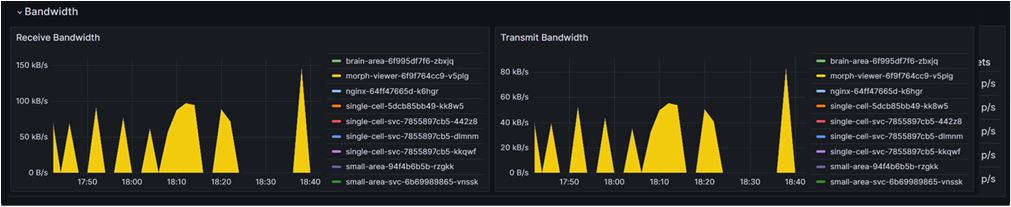
Bandwidth
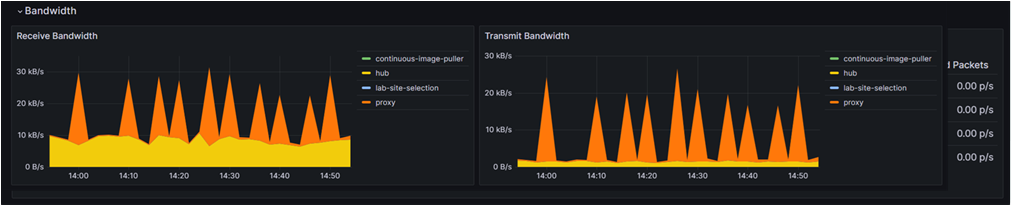
| No | Frame | Description |
|---|---|---|
| 1 | Receive Bandwidth | Displays the bandwidth usage for data received over time, categorized by workload |
| 2 | Transmit Bandwidth | Displays the bandwidth usage for data transmitted over time, categorized by workload |
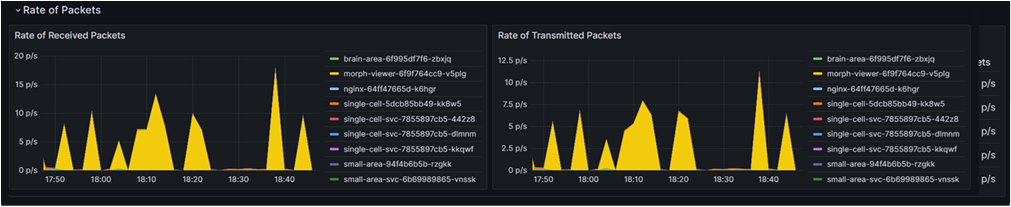
Rate Of Packets
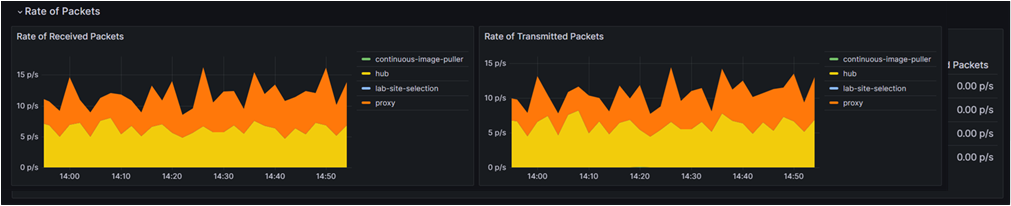
| No | Frame | Description |
|---|---|---|
| 1 | Rate of Received Packets | Displays the rate at which packets are received over time, categorized by workload |
| 2 | Rate of Transmitted Packets | Displays the rate at which packets are transmitted over time, categorized by workload |
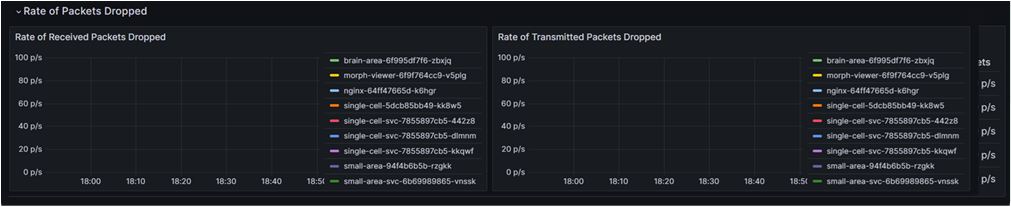
Rate Of Packets Dropped
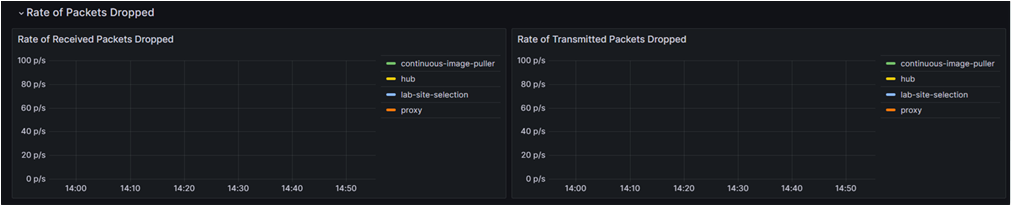
| No | Frame | Description |
|---|---|---|
| 1 | Rate of Received Packets Dropped | Displays the rate at which received packets are dropped over time, categorized by workload |
| 2 | Rate of Transmitted Packets Dropped | Displays the rate at which transmitted packets are dropped over time, categorized by workload |
Dashboard for Pods
Prompts
| No | Prompt | Description |
|---|---|---|
| 1 | Time Range | Define the time range for which the dashboard will display data |
Sections
Headlines
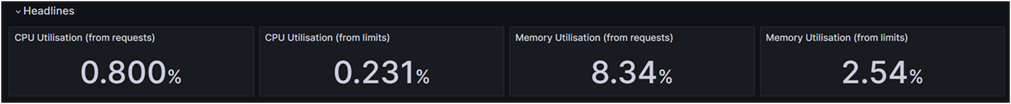
| No | Frame | Description |
|---|---|---|
| 1 | CPU Utilisation (from requests) | Displays the percentage of CPU usage based on requested resources |
| 2 | CPU Utilisation (from limits) | Displays the percentage of CPU usage based on resource limits |
| 3 | Memory Utilisation (from requests) | Displays the percentage of memory usage based on requested resources |
| 4 | Memory Utilisation (from limits) | Displays the percentage of memory usage based on resource limits |
CPU Usage
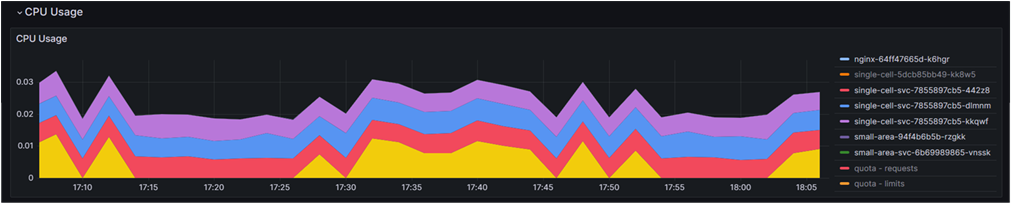
| No | Frame | Description |
|---|---|---|
| 1 | CPU Usage | Displays a stacked area chart showing CPU usage over time for different pods |
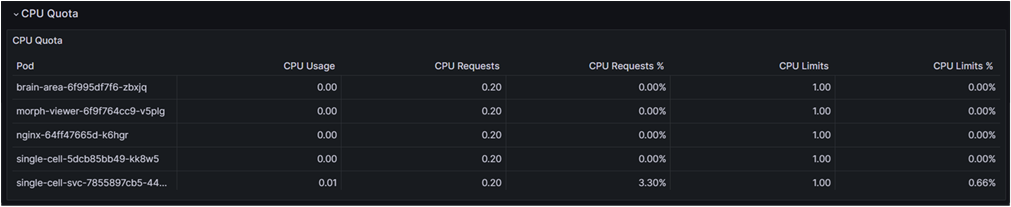
CPU Quota
| No | Frame | Description |
|---|---|---|
| 1 | Pod | Lists the names of the pods being monitored |
| 2 | CPU Usage | Displays the actual CPU usage for each pod |
| 3 | CPU Requests | Displays the requested CPU resources for each pod |
| 4 | CPU Requests % | Displays the percentage of requested CPU resources used by each pod |
| 5 | CPU Limits | Displays the maximum CPU limits set for each pod |
| 6 | CPU Limits % | Displays the percentage of CPU limits used by each pod |
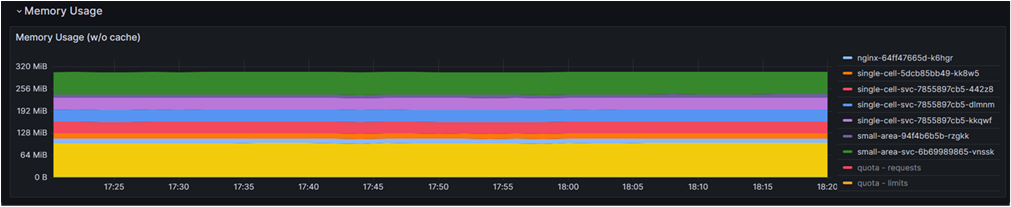
Memory Usage
| No | Frame | Description |
|---|---|---|
| 1 | Memory Usage (w/o cache) | Displays the memory usage over time for different pods |
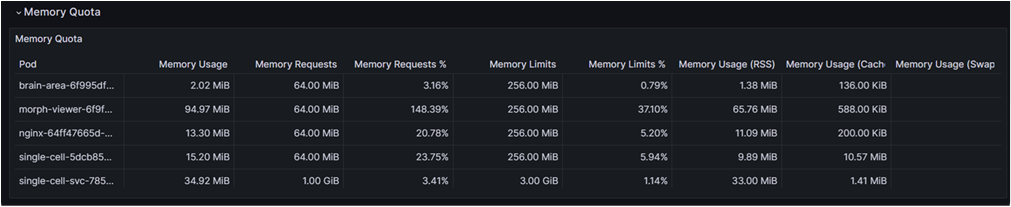
Memory Quota
| No | Frame | Description |
|---|---|---|
| 1 | Pod | Lists the names of the pods being monitored |
| 2 | Memory Usage | Displays the actual memory usage for each pod |
| 3 | Memory Requests | Displays the requested memory resources for each pod |
| 4 | Memory Requests % | Displays the percentage of requested memory resources used by each pod |
| 5 | Memory Limits | Displays the maximum memory limits set for each pod |
| 6 | Memory Limits % | Displays the percentage of memory limits used by each pod |
| 7 | Memory Usage (RSS) | Displays the Resident Set Size (RSS), which is the non-swapped physical memory used by each pod |
| 8 | Memory Usage (Cache) | Displays the cache memory used by each pod |
| 9 | Memory Usage (Swap) | Displays the swap memory used each pod |
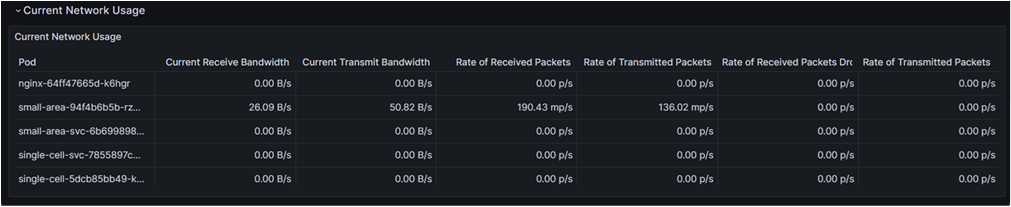
Current Network Usage
| No | Frame | Description |
|---|---|---|
| 1 | Pod | Lists the names of the pods being monitored |
| 2 | Current Receive Bandwidth | Displays the current bandwidth used for receiving data by each pod |
| 3 | Current Transmit Bandwidth | Displays the current bandwidth used for transmitting data by each pod |
| 4 | Rate of Received Packets | Displays the current rate of received packets by each pod |
| 5 | Rate of Transmitted Packets | Displays the current rate of transmitted packets by each pod |
| 6 | Rate of Received Packets Dropped | Displays the rate of packets dropped during reception by each pod |
| 7 | Rate of Transmitted Packets Dropped | Displays the rate of packets dropped during transmission by each pod |
Bandwidth
| No | Frame | Description |
|---|---|---|
| 1 | Receive Bandwidth | Displays a line chart showing the bandwidth used for receiving data over time, categorized by pod |
| 2 | Transmit Bandwidth | Displays a line chart showing the bandwidth used for transmitting data over time, categorized by pod |
Rate Of Packets
| No | Frame | Description |
|---|---|---|
| 1 | Rate of Received Packets | Displays a line chart showing the rate of received packets over time, categorized by pod |
| 2 | Rate of Transmitted Packets | Displays a line chart showing the rate of transmitted packets over time, categorized by pod |
Rate Of Packets Dropped
| No | Frame | Description |
|---|---|---|
| 1 | Rate of Received Packets Dropped | Displays a line chart showing the rate of packets dropped during reception over time, categorized by pod |
| 2 | Rate of Transmitted Packets Dropped | Displays a line chart showing the rate of packets dropped during transmission over time, categorized by pod |
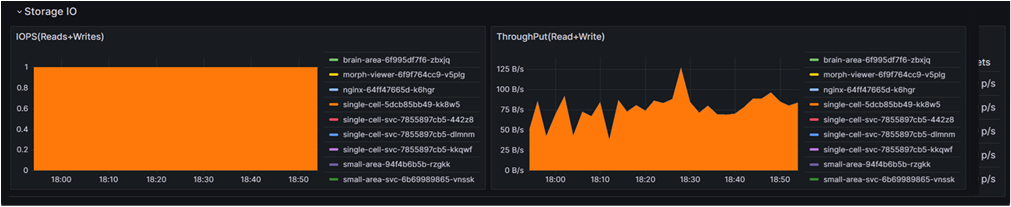
Storage IO
| No | Frame | Description |
|---|---|---|
| 1 | IOPS (Reads + Writes) | Displays a bar chart showing the Input/Output Operations Per Second (IOPS) for reads and writes, categorized by pod |
| 2 | Throughput (Read + Write) | Displays a line chart showing the data throughput (read and write) over time, categorized by pod |